Plan Limits Viewer
You can check out the Plan Limits Viewer at https://www.gw.govt.nz/environment/environmental-data-and-information/water-monitoring/water-quantity-allocations/
Context
Regional Councils create plans which set out objectives and policies that govern usage of that Region’s resources. These plans contain measurable limits or targets that can be compared to environmental observations or consents data to help understand how the council is performing against these limits.
These plans are generally published in text based formats such PDF files, referencing Geospatial boundaries coming from Council GIS systems. For end-users, this means large amounts of text often containing complex rules need to be read and understood to know what limits apply to which areas. This format also makes it is difficult to build digital solutions that can compare these limits to other data sets.
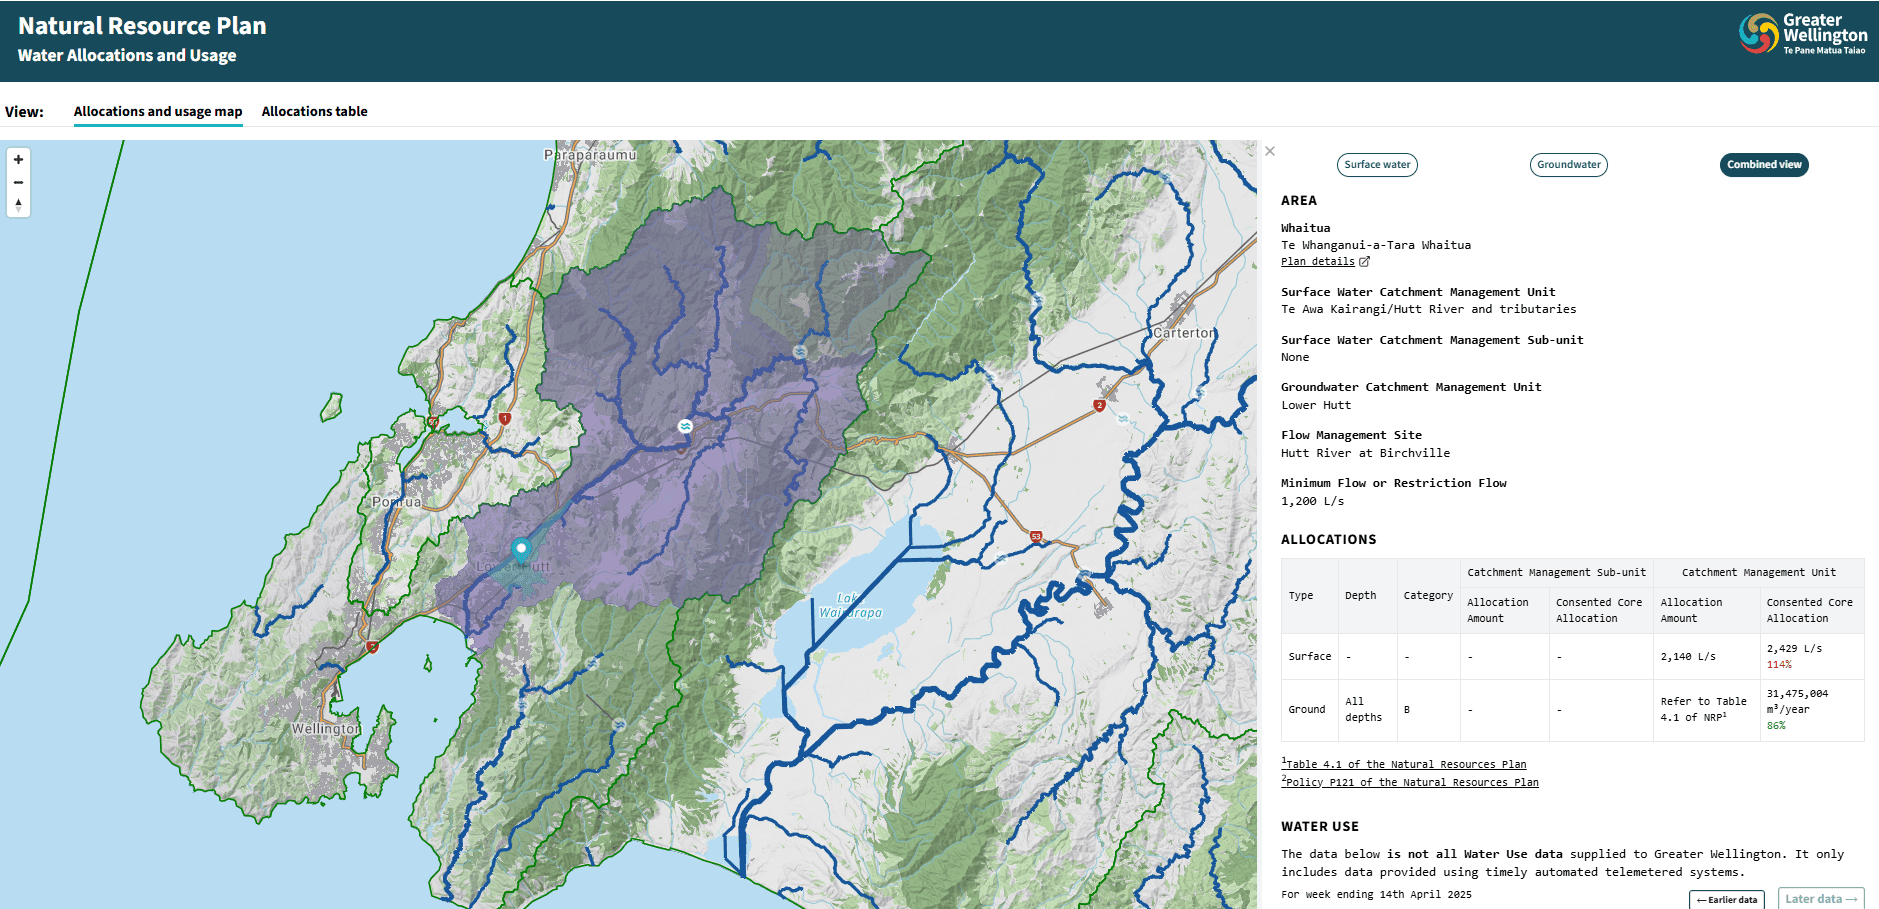
The Plan Limits Viewer digitises these rules alongside the GIS data they reference, allowing a user to easily understand what limits apply where. It has been developed with Greater Wellington data sources as a starting point. We prototyped integrating other regional council’s data sources which demonstrated that the bones of the webapp was able to provide for other regions data but with their own skin to reflect regional nuance’s. Greater Wellington’s implementation of PLV has its own skin to reflect its Natural Resources Plan.
Since then, we have included more data sources from our consents management and environmental monitoring systems to tell users how much water has been allocated to consent holders and how much water they are using. The data is aggregated to a catchment level to avoid any privacy issues.
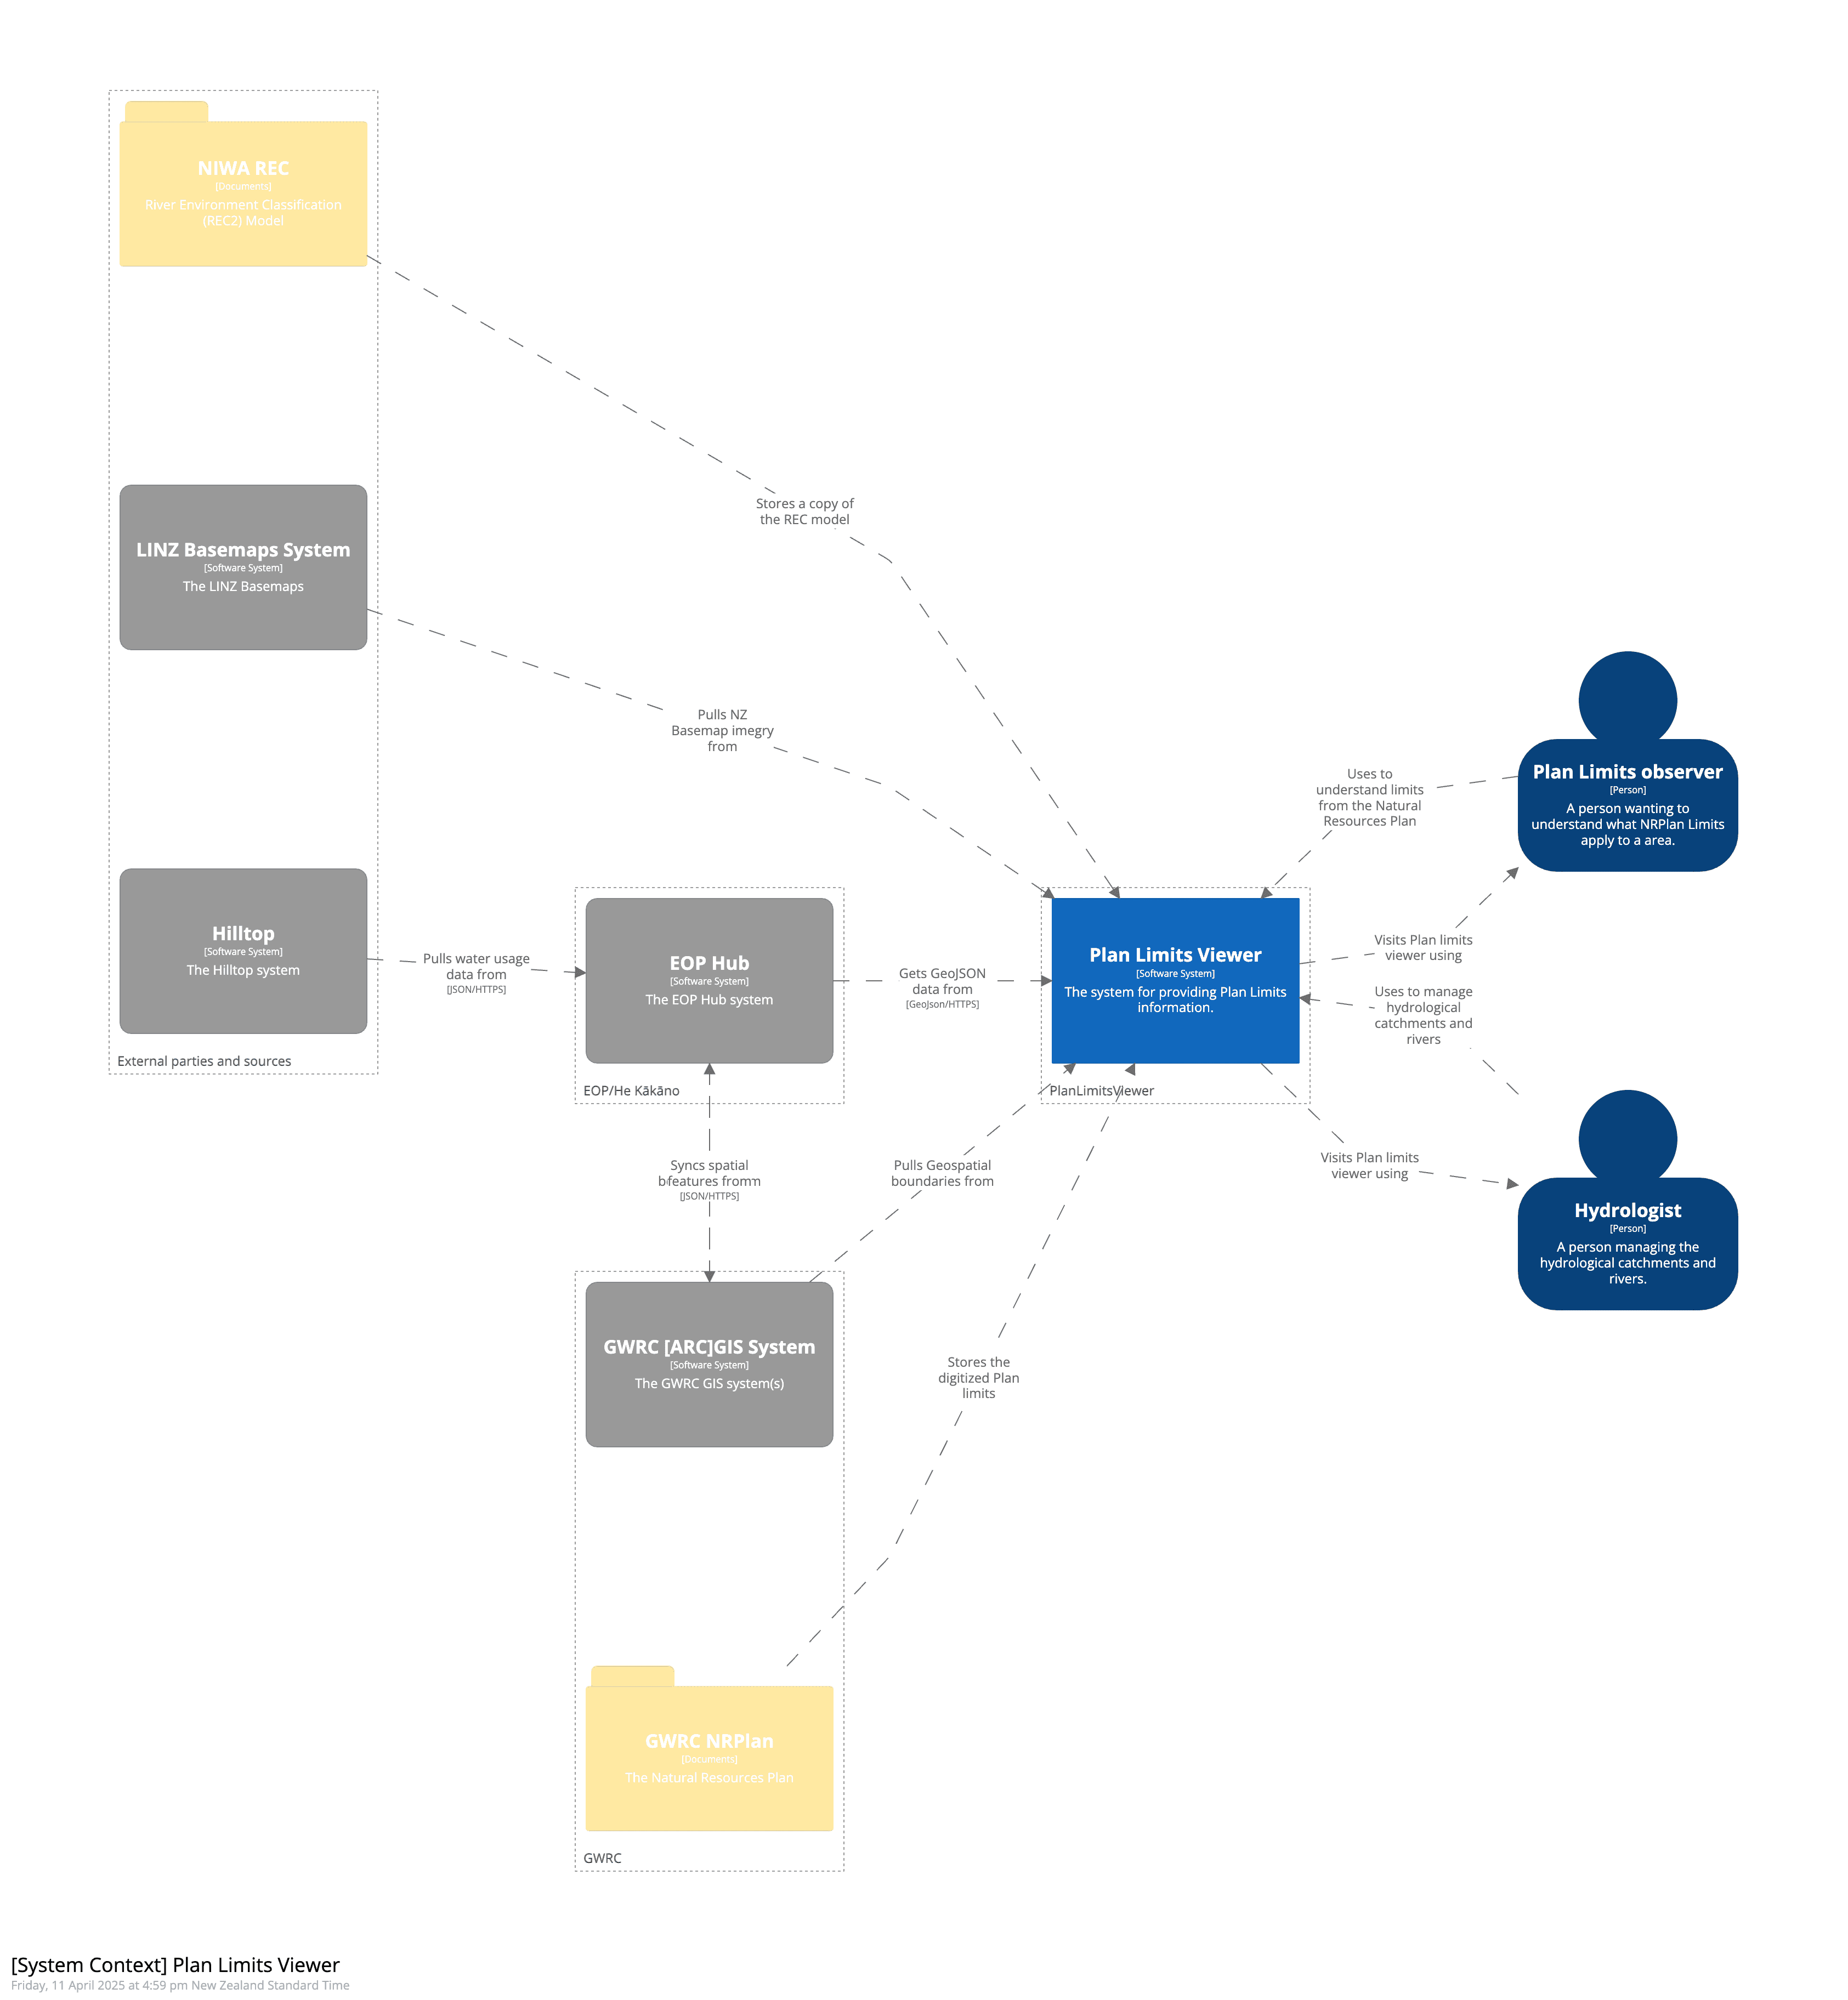
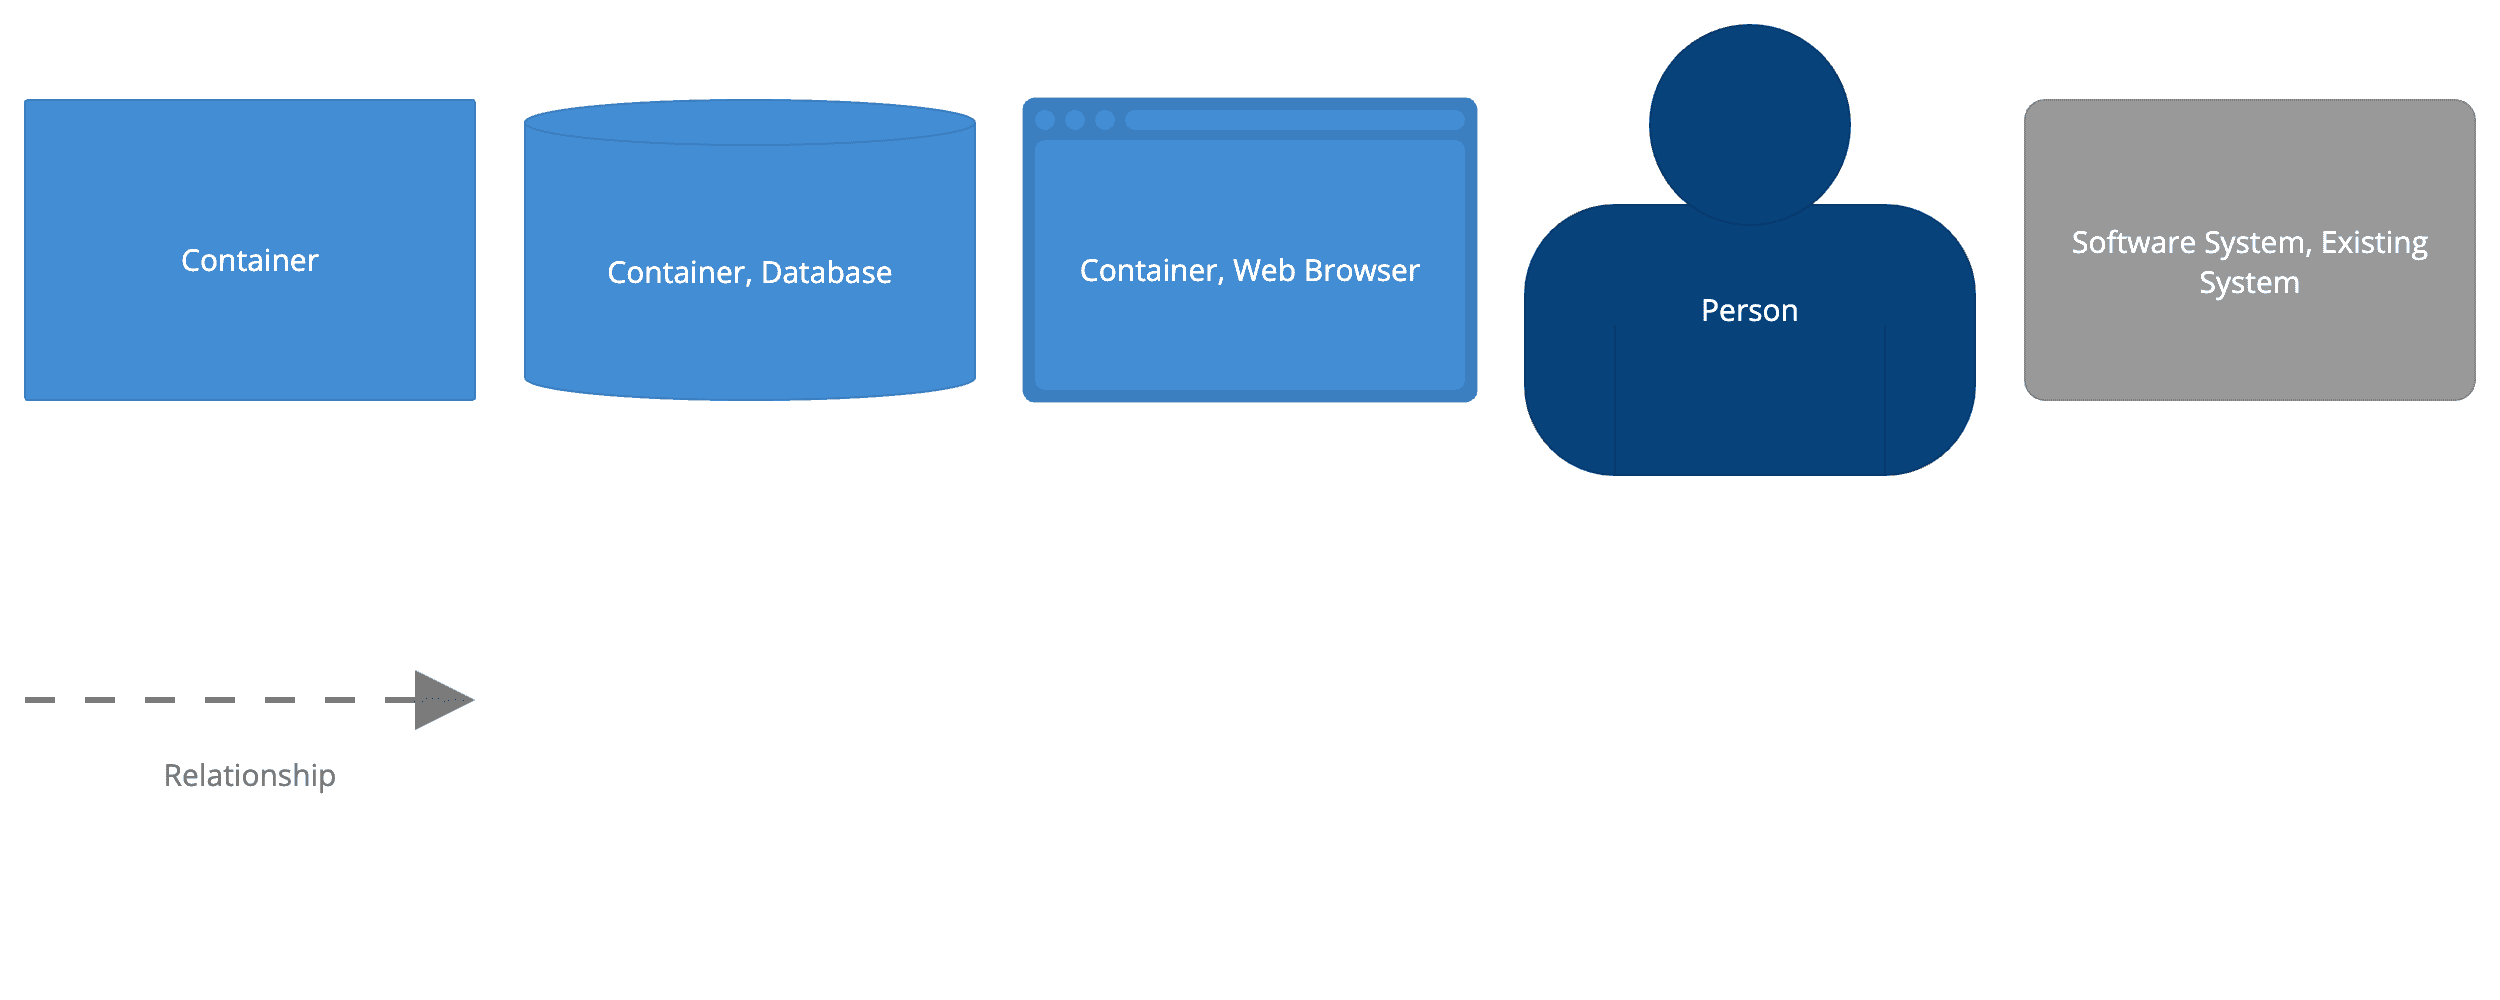
High-level architecture
The diagram below shows the high level technical architecture of the Plan Limits system
Key areas:
Web Application UI
This is the front-end UI that end-users interact with to view Plan Limits. It's deployed as static HTML/CSS/JS to AWS S3 and served via AWS Cloudfront. It consumes data from the Management API, the Tile Server and LINZ Basemaps.
Key technologies:
- Typescript - Type safe language that transpiles to Javascript
- React - A JavaScript library for building user interfaces
- Tanstack Query - Data loading and state management library
- Tailwind CSS - CSS framework
- MapLibre - Mapping Library
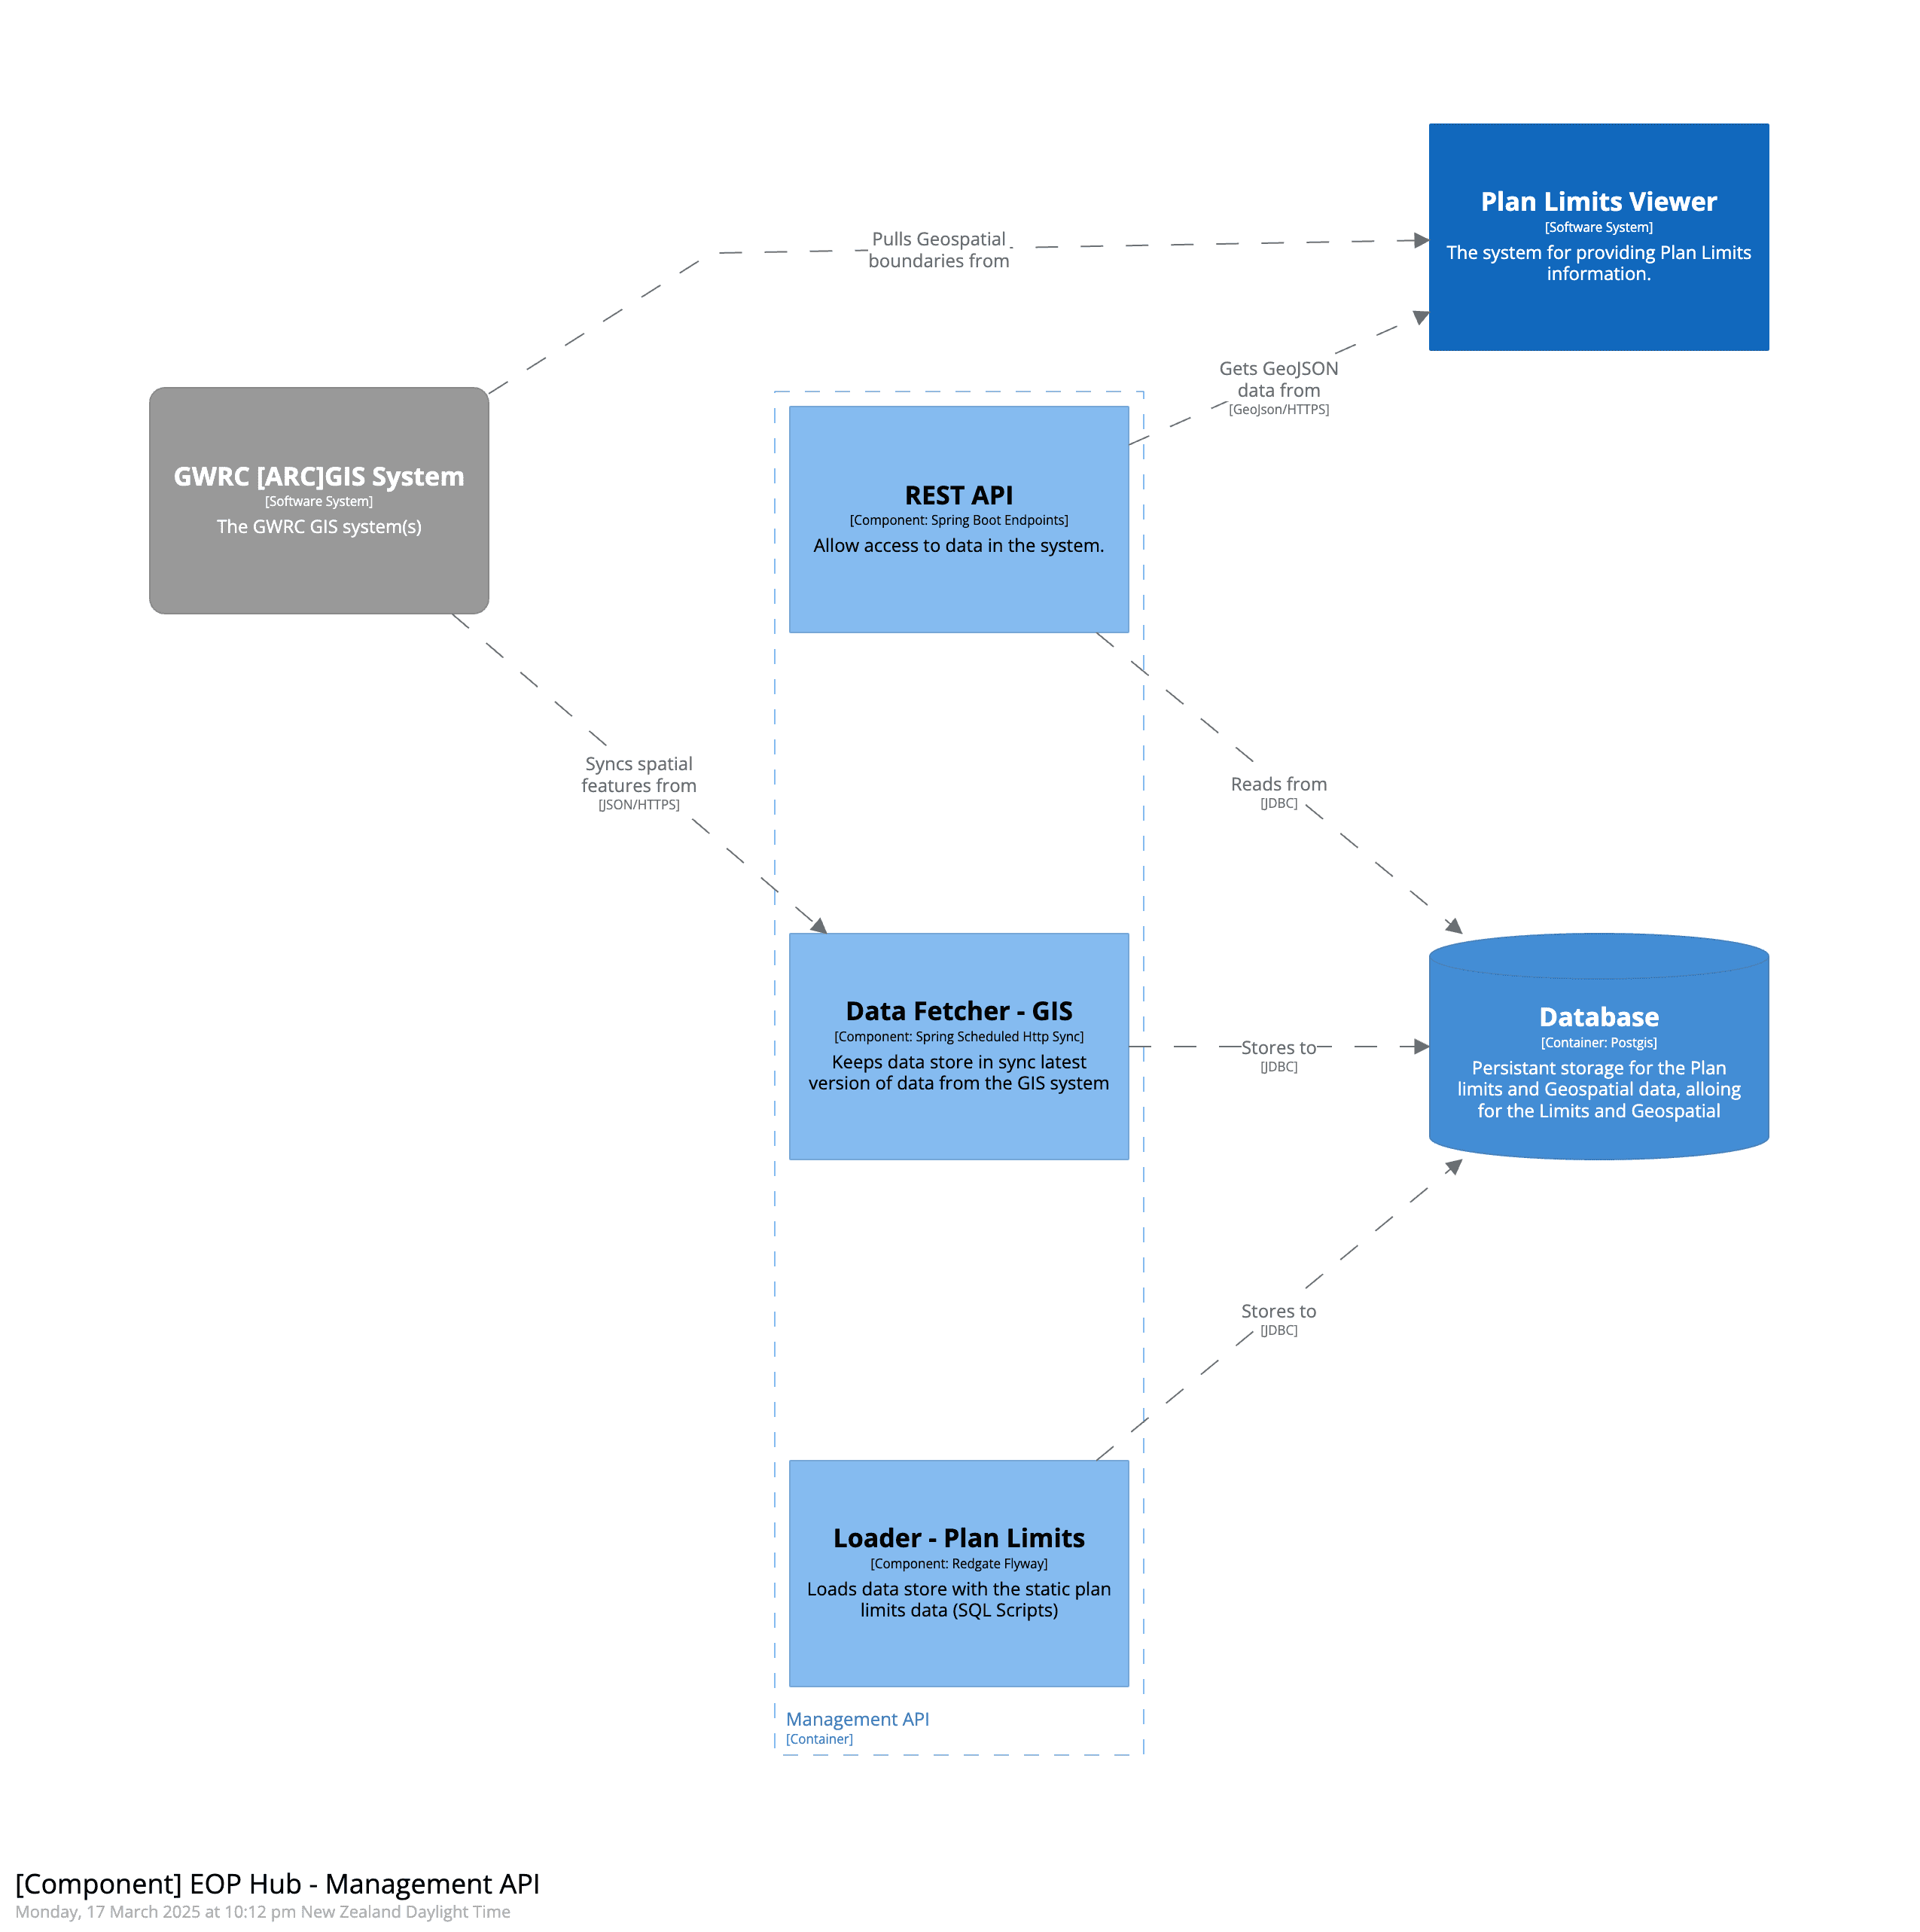
Management API
This is a server-side application that exposes APIs for the Plan Limits Viewer to consume data. The Manager is also responsible for updating various data sources that the Plan Limits Viewer is based on included:
- Infrequently changing data GIS from LINZ (such as the NZ River data), imported in batch
- Councils specific GIS boundary data, pulled periodically from ESRI APIs
- Plan and Consent data, consumed from an internal Kafka Broker
The application is deployed in a Docker Containers using Amazon ECS. Key technologies include:
- Kotlin - A modern JVM language
- Spring Boot - A production grade Application Framework
- jOOQ and Flyway - Data access and management libraries
Ingest API
This is a server-side applications which exposes authenticated APIs to accept incoming Plan and Consent data from Councils, and persist this to a Kafka Broker. It's developed and deployed using the same technology stack as the Management API.
Vector Tile Server
This is a simple containerised deployment of pg_tileserv, which connects to the database and serves NZ River GIS data directly to the Web Application as Vector Tiles.
Database
This is a Postgres database with PostGIS extensions installed deployed via AWS RDS.
Kafka Broker
This is a standard Kafka Broker deployed using AWS EKS. It is used to accept incoming data mainly from Hilltop.
Hilltop Crawler
The Hilltop Crawler is a custom application that periodically queries the Hilltop service for water usage data and pushes this to the Kafka Broker.
Hosting
The solution is currently hosted on AWS leveraging managed services where possible, and making use Terraform to ensure infrastructure and configuration is defined as code.